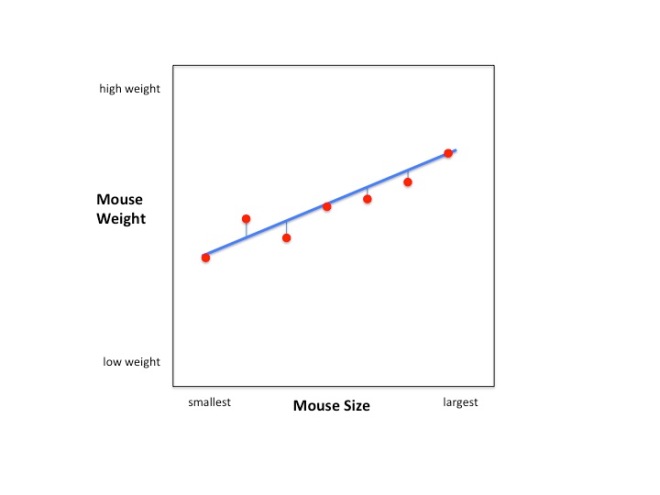
R squared is an awesome metric of correlation – which is to say, it’s an awesome way to assess how two quantitative variables might be related. For example, mouse weight and size might be correlated. (This example is pretty obvious – a bigger mouse will probably weigh more than a smaller one, unless the bigger one is just fluff).
Looking at the raw data for 7 mice (n=7) we see that there is a trend: larger mice tend to weigh more than smaller mice.

The blue line illustrates the correlation between mouse weight and mouse size. Bigger mice tend to weigh more.
Can we use this trend to predict a mouse’s weight if we know it’s size? How good is this prediction? R-squared can answer these questions. It is an easy to calculate and easy to interpret metric of correlations (i.e. the relationship between mouse size and mouse weight.) R-squared is the percentage of variation in the data that the relationship accounts for.
What’s the variation in the data? That’s easy, it’s the difference between the individual data points and the mean.

Calculating the variation in the data. It’s the squared differences between the data points and the mean.
How do we calculate the variation around the mouse/weight relationship? We just calculate the variation around the blue line that we drew before.

The variation around the line is just the squared differences between the data points and the blue line.
Now to calculate the percentage of variation that mouse/weight relationship accounts for, we just subtract the the variation around the line from the variation around the mean and then divide by the variation around the mean. Here it is in pictures:

In the bottom of the graph we have the formula for R-squared. All we need to know to calculate it is the variation around the mean and the variation around the blue line.

Lastly, we divide by the variation around the mean. This implies that the numerator will be a percentage of the variation around mean since the variation around the line will never be less than 0 and it will never be greater than the variation around the mean.
Now let’s use some numbers to calculate a real R-squared!


You are the best!
It’s a shame that now I need to pay for your videos
The videos all free to watch on YouTube so I don’t understand your comment.
They are not, https://www.youtube.com/watch?v=2AQKmw14mHM, check this video, it’s about the R^2. Whenever I want to watch it, a pay wall appears.
Whoa!!! I have no idea how that happened. I’ll contact YouTube immediately and complain. Thanks for pointing this out.
They are not, https://www.youtube.com/watch?v=2AQKmw14mHM, check this video, it’s about the R^2. Whenever I want to watch it, a pay wall appears.